Vibe coding can get you from an idea to a working app astonishingly quickly. It can also leave you staring at a folder full of files, three terminal windows, and an error message you do not understand.
I built DevDock for myself first. It is deliberately a serious developer tool: a local workspace for projects, commands, Git, Docker, databases, project health, and security checks. But that does not make it useful only to people who enjoy typing commands from memory. In some ways, the less you want to live in a terminal, the more useful a clear control panel becomes.
01 / The useful mismatch
A hardcore tool can make technical work less mysterious
A coding agent can write a feature, install a package, create a database migration, or suggest a command. It may even run the command for you. The hard part starts when you want to come back tomorrow, understand what is running, repeat the successful step, or decide whether a scary-looking action is safe.
DevDock does not generate code and it does not contain an AI assistant. It sits around your local projects and gives the ordinary machinery of software development a visible, repeatable interface. You still need judgment, backups, and help when something is genuinely unfamiliar. You just do not have to keep the entire project in your head.
Let the AI help write the code. Keep the controls, history, and safety checks where you can see them.
02 / Know what you have
Turn an AI-made folder into a project you can navigate
Many vibe-coded projects begin with a prompt and end with a folder. Inside that folder may be a web app, a server, a mobile project, Docker files, and a collection of tools with unfamiliar names. DevDock inspects a bounded set of project files without running the project and shows the technologies it recognizes.
See what kind of project the agent created
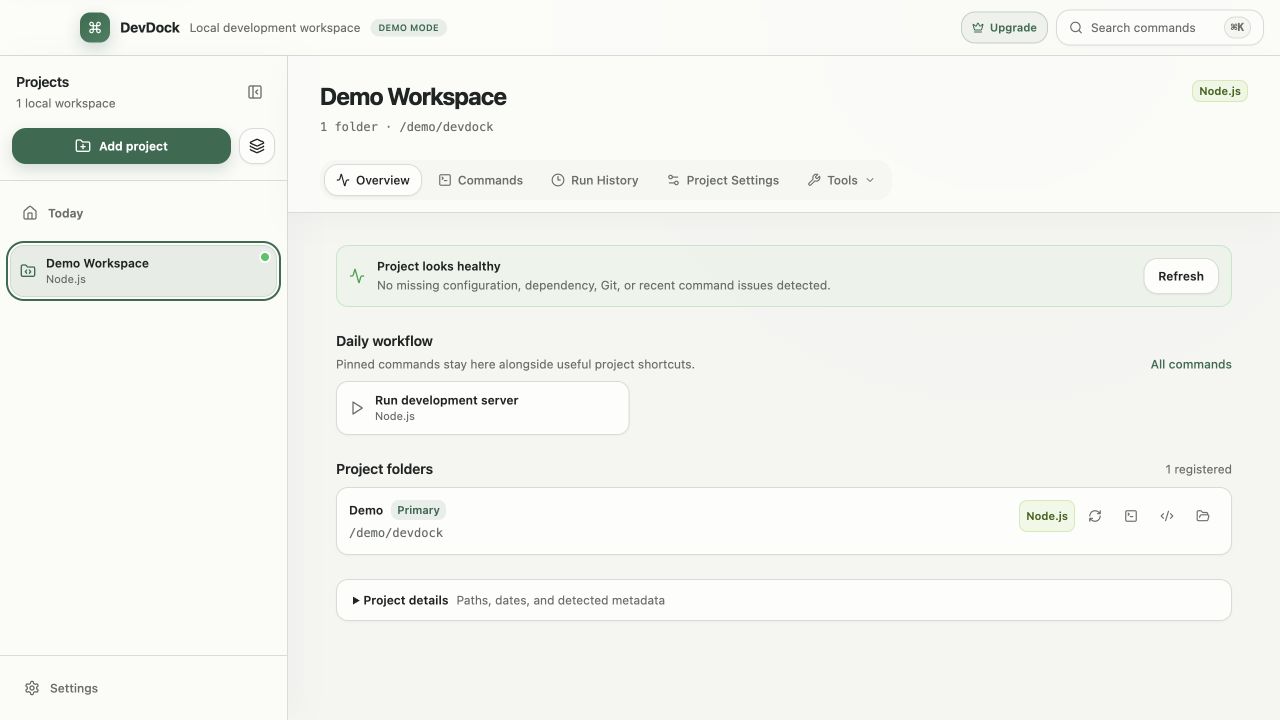
Add the folder and review the detected languages, frameworks, package managers, source control, and Docker setup. You do not need to know what every label means immediately. The first win is having a map instead of an anonymous pile of files.
Keep several experiments from becoming one big mess
Every registered project gets its own overview, commands, history, health, and tools. Recent projects and favourites take you back to the right experiment, and its folder can be opened in the file manager, a terminal, or Visual Studio Code from the same workspace.
Keep the frontend and backend together
A Pro project can contain several labelled folders—even if they live in separate repositories—so a web frontend, API, mobile app, and infrastructure folder can remain one logical product without moving their files.
03 / Stop memorising incantations
Make the useful parts repeatable
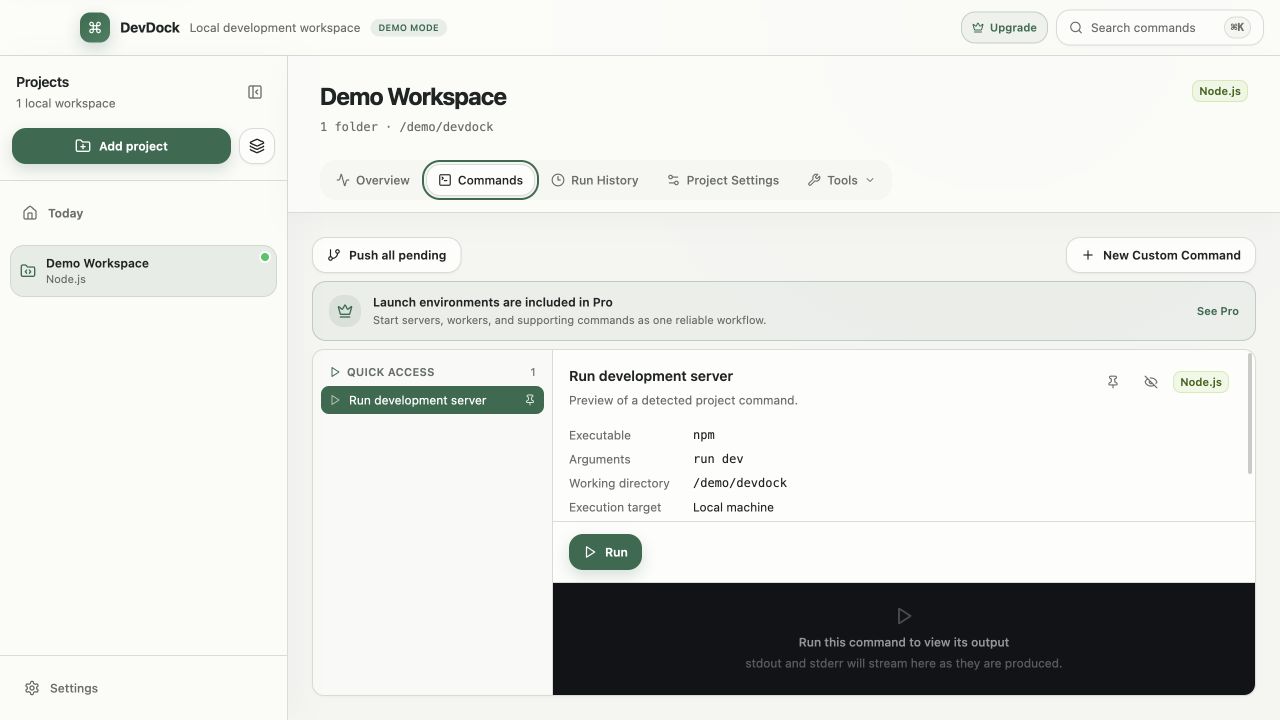
A terminal command is simply an instruction written as text. Commands such as npm run dev or git status are not inherently more powerful because they are hard to remember. DevDock turns detected project commands into labelled actions while keeping the actual executable, arguments, folder, and target visible.
Start the app without retyping the magic words
Choose a generated development command and press Run. DevDock shows what it will execute and where before it starts, then keeps normal output and error output visually distinct.
Pin the few actions you actually use
Keep useful commands in the project’s Daily Workflow and return to recent projects from Today. Pro can also save a command an agent gave you, including repeatable inputs, or combine servers, workers, and supporting services into an environment that starts in an intentional order.
Find the last thing that worked
Run history keeps the task, timing, completion state, and retained output connected. Free keeps the 20 newest matching history entries per project; Pro unlocks complete history and workflow insights.
04 / Before “yes, do it”
Add checkpoints around AI-generated changes
The biggest risk in vibe coding is not that you do not know every line of syntax. It is that you may approve a change without understanding its scope. DevDock cannot make that decision for you, but it can put more evidence in front of you.
Use Git as a set of save points
Git is the project’s change history. DevDock provides status, branches, diff summaries, recent commits, staging, commit, fetch, pull, and push workflows. Before a commit, you can select files and inspect their textual changes instead of accepting one invisible bundle.
See what Docker is doing
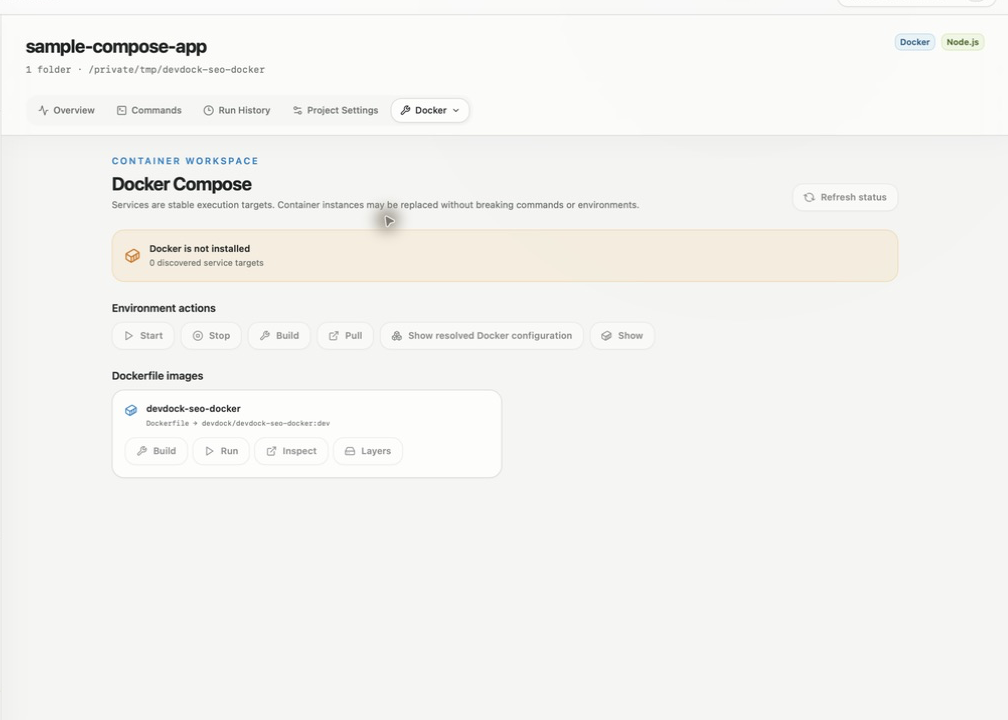
Docker runs parts of a project in controlled containers. DevDock can show Compose services, health, ports, processes, logs, and resource snapshots, then start, stop, restart, build, pull, or inspect them without asking you to memorise Compose syntax.
Catch obvious setup and security problems
Project health can point out missing dependency folders, toolchain mismatches, configuration contracts, Git state, Docker availability, or recent command failures. The separate read-only local security audit looks for exposed secrets, tracked credential files, private keys, unsafe links, and missing lockfiles.
Look at the database without starting with raw SQL
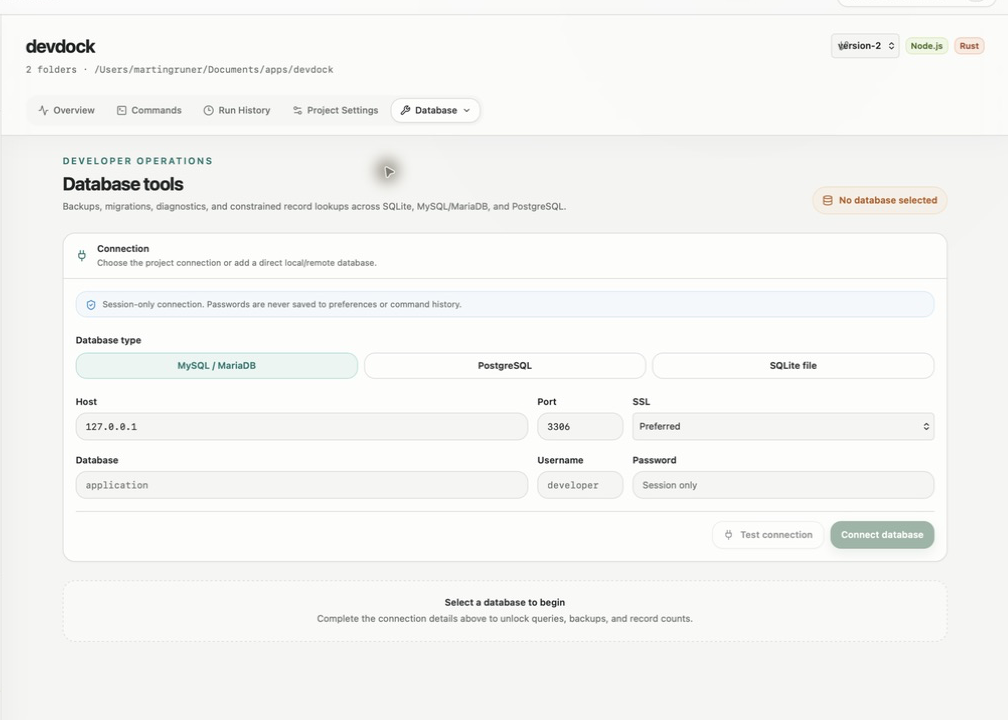
Pro database tools can browse schemas and preview a bounded, read-only set of records for SQLite, MySQL/MariaDB, and PostgreSQL. Exports and restores remain explicit operations; imports, wipes, and seed actions require confirmation because they can change data.
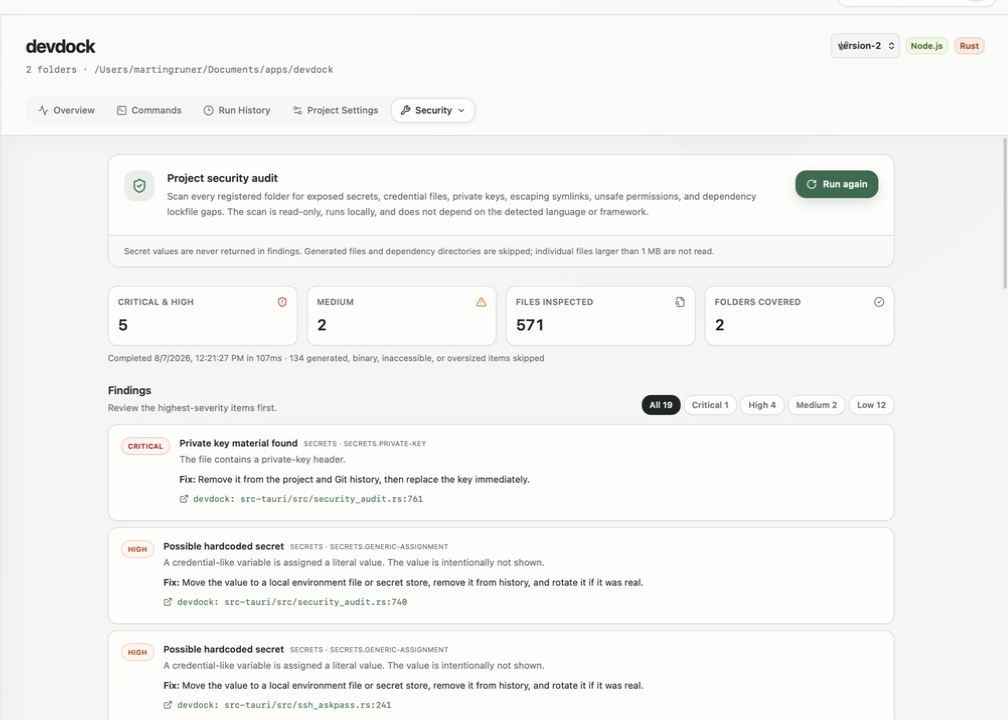
A clean audit is not proof that an app is secure. It is a practical baseline—particularly useful after a fast AI-assisted session in which new files and dependencies arrived faster than you could review them.
05 / A calmer loop
A simple DevDock routine for your next vibe-coded app
First, add the project folder. Read the detection summary and warnings before saving it. Nothing is moved or uploaded, and removing the DevDock project later removes the reference rather than the source files.
Second, start with one bounded command. A status check, type check, or test suite is easier to understand than starting every service at once. Read the visible executable, arguments, folder, and target before pressing Run.
Third, pin what succeeds. Put the development command you use every day in the project overview. If the project needs several processes, a Pro environment can start them in order and stop or restart them from the same workspace.
Fourth, inspect before you save or share. Check Git status and the file changes, create a commit as a named checkpoint, then review the dedicated push step before sending commits to the remote repository.
Fifth, run health and security checks. Do this after adding a large feature or unfamiliar dependency, and before a release. Take warnings back to your coding agent as specific questions: what does this file do, why is this permission needed, or how should this secret be moved out of source control?
06 / The honest boundary
What DevDock will not do for you
DevDock does not explain every unfamiliar concept, review whether an AI’s architecture is sensible, prove that generated code is correct, or guarantee that an app is secure. Project detection tells you what DevDock recognized, not whether the project was designed well.
It also does not remove the need to read confirmation dialogs. A friendly button can still launch a command that changes files, databases, containers, or remote repositories. DevDock uses visible commands and stronger confirmation for consequential built-in operations, but the decision remains yours.
The best use of DevDock and a coding agent is a loop: let the agent help you build, use DevDock to run and inspect the result, then return concrete output, diffs, health warnings, or security findings to the agent when you need an explanation or repair.
07 / Start small
You can use the useful safety layer before going Pro
Free supports up to three local projects and includes automatic detection, generated built-in commands, live output and process controls, the 20 newest matching history entries per project, and core Git, Docker, project-log, project health, and security-audit tools. There is no daily command or Git-diff quota.
DevDock Pro is a one-time purchase. It unlocks unlimited and multi-folder projects, custom commands and combined workflows, saved multi-process environments, complete history and insights, database tools, SSH transfers, and configuration backup and restore.
That boundary is useful for a vibe coder: begin by registering one real project, run the built-in checks, and see whether a visible project control panel makes your work calmer. Upgrade when the parts you want to make durable—custom workflows, deeper history, several folders, or database work—actually become part of your routine.