Direct answer
How is a developer command runner different from a terminal?
DevDock turns recurring development commands into visible, reviewable tasks. Every run keeps its command, executable and arguments, working directory, exit state, timing, and retained output together, so a useful command does not disappear into shell history.
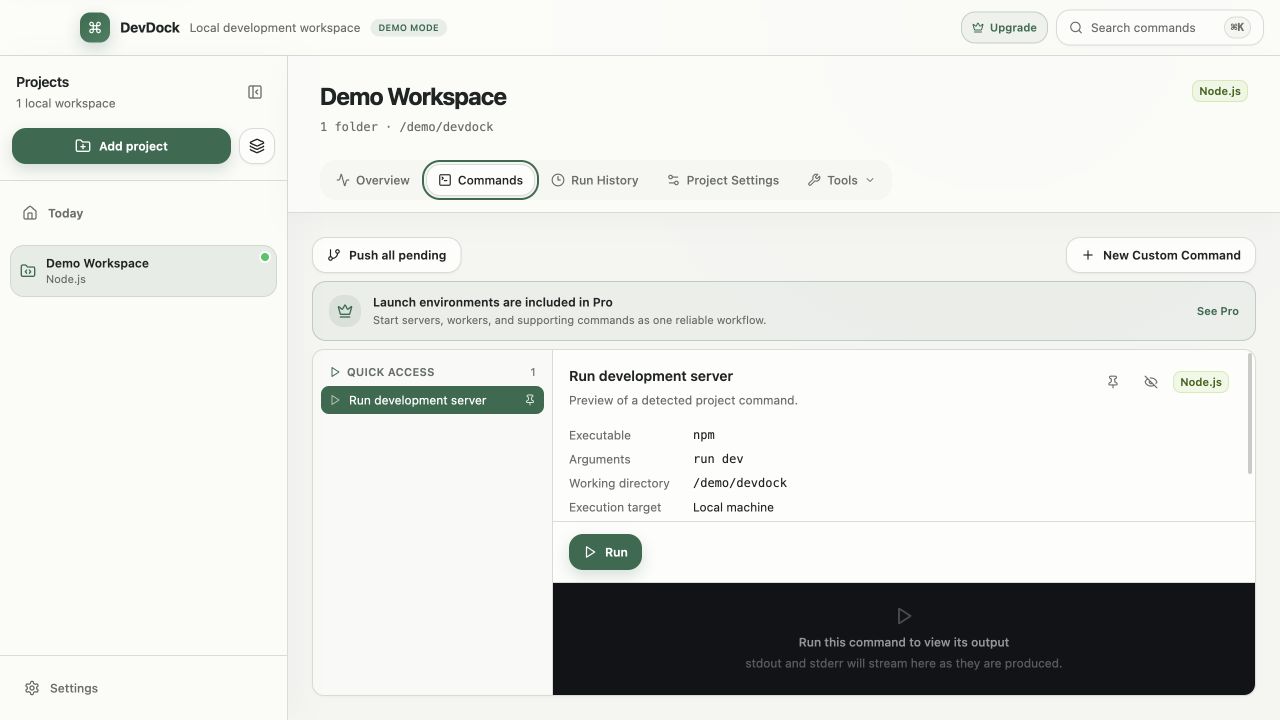
Ready to run
Commands are generated from what the project contains.
Most commands do not need to be typed in. DevDock builds them from the detected stack: every package.json script with the project's package manager (npm, pnpm, Yarn or Bun), Composer scripts and repository-defined Artisan commands, pytest and Django management commands, cargo check, build, test and Clippy, go test, vet and build, .NET restore, build and test, and Maven or Gradle test and build. Each one runs in the folder it belongs to.
Frequent development, test and build actions sit in a Common group at the top of the list. Commands that need input, such as a Laravel queue name or a target device for a Flutter or React Native session, show a form first, and you can save the values as a named preset for next time.
While it runs
Live output, a clear result, and a Stop that ends the whole process tree.
Every generated command is an executable plus a list of arguments, not a shell command line that DevDock assembles for you. Standard output and error stream into the output panel in different styles. Stop ends the command and every child process it started, which matters for dev servers that spawn watchers. By default DevDock asks you to confirm before stopping a running command; you can turn that off in Application Settings.
Commands marked destructive, such as Remove Docker environment or Wipe database, open a review screen first. It shows the exact executable, arguments, working directory, execution target and environment variables, and nothing runs until you choose Run destructive command.
Notify when commands complete is on by default. It sends a desktop notification when a command finishes, fails or is stopped after running for at least the Minimum command duration, which starts at 10 seconds and can be changed in Application Settings.
Run history
Each run is recorded with its output.
Each run is recorded with the command name, executable, arguments, working directory, start time, duration, exit code and output. The logs are stored in DevDock's data folder, not in your project. Run History filters by command and by status (Running, Succeeded, Failed or Terminated), and from there you can reopen the output, choose Run Again or delete the entry with its logs.
Maximum retained days and Maximum entries per project in Application Settings control how much history is kept; by default that is 30 days and up to 200 runs per project. DevDock Free shows the 20 most recent of those runs per project. DevDock Pro shows every retained run and adds Insights & Audit, with success rates, run durations and recurring failures per command.
Your own commands
Save and combine your own commands with DevDock Pro.
New Custom Command covers what the generated list does not. Choose Run a command to set the executable, arguments, working folder, environment variables and a confirmation level. Choose Run saved commands in sequence to chain existing custom commands; the steps run top to bottom and stop at the first failure.
Run-time parameters turn part of a command into a text field, dropdown or text with suggestions that you fill in each time it runs. Environment values marked Secret are stored in Windows Credential Manager and are kept out of run history, backups and diagnostics. Use shell is available when you need pipes or redirects; it runs through the Windows command shell and shows a warning, while direct execution stays the default.
Best for
Where this workflow fits.
- Starting dev servers, queue workers, watchers and Docker services without retyping them
- Running install, test and build commands across projects in different languages
- Checking the output and exit code of an earlier run when something breaks
- Turning a multi-step terminal routine into one saved command with DevDock Pro
Local project data, operating-system secret storage, read-only local audits, and no source upload.
Relevant capabilities
What DevDock brings to the job.
Practical workflow
From setup to a reviewed result.
Open Commands
Pick a project and browse its generated commands, grouped by technology with Common actions first.
Fill in inputs if asked
Enter required values or load a saved preset. Destructive commands show the exact command for review.
Watch the output
Follow stdout and stderr as they stream. Stop ends the command and its child processes.
Come back to it later
Open Run History to read old output and exit codes, or run the same command again.
Useful in practice
Direct answers
Questions about developer command runner.
How is a developer command runner different from a terminal?
DevDock turns recurring development commands into visible, reviewable tasks. Every run keeps its command, executable and arguments, working directory, exit state, timing, and retained output together, so a useful command does not disappear into shell history.
Does DevDock run commands through a shell?
Not by default. Generated and custom commands run as an executable with an argument list. Shell mode is an explicit option on custom commands in DevDock Pro and shows a warning when enabled.
Can I start a command from the keyboard?
Yes. Ctrl+K opens the command palette by default, and you can change the shortcut in Application Settings. Commands that need input or confirmation open their review screen instead of starting straight away.
Can I add commands for a tool DevDock does not detect?
Yes. A .devdock/technology.json file in the repository can add direct commands that behave like built-in ones, and DevDock Pro lets you create custom commands inside the app.
Is there a daily limit on commands in the free version?
No. DevDock Free has no command quota. Its limit is on history: Run History shows the 20 most recent runs per project.
Go deeper
Create dependable project commands, choose safe execution targets, manage long-running work, and use history to diagnose failed runs.
Read Commands, workflows, and run historyFree & Pro: what’s included
Available on the Microsoft Store. Free for up to three local projects with core commands, Git, Docker, project health checks, and security-audit tools. A one-time Pro purchase unlocks unlimited and multi-folder projects, custom workflows, full history and insights, database tools, SSH transfers, and configuration backup and restore.